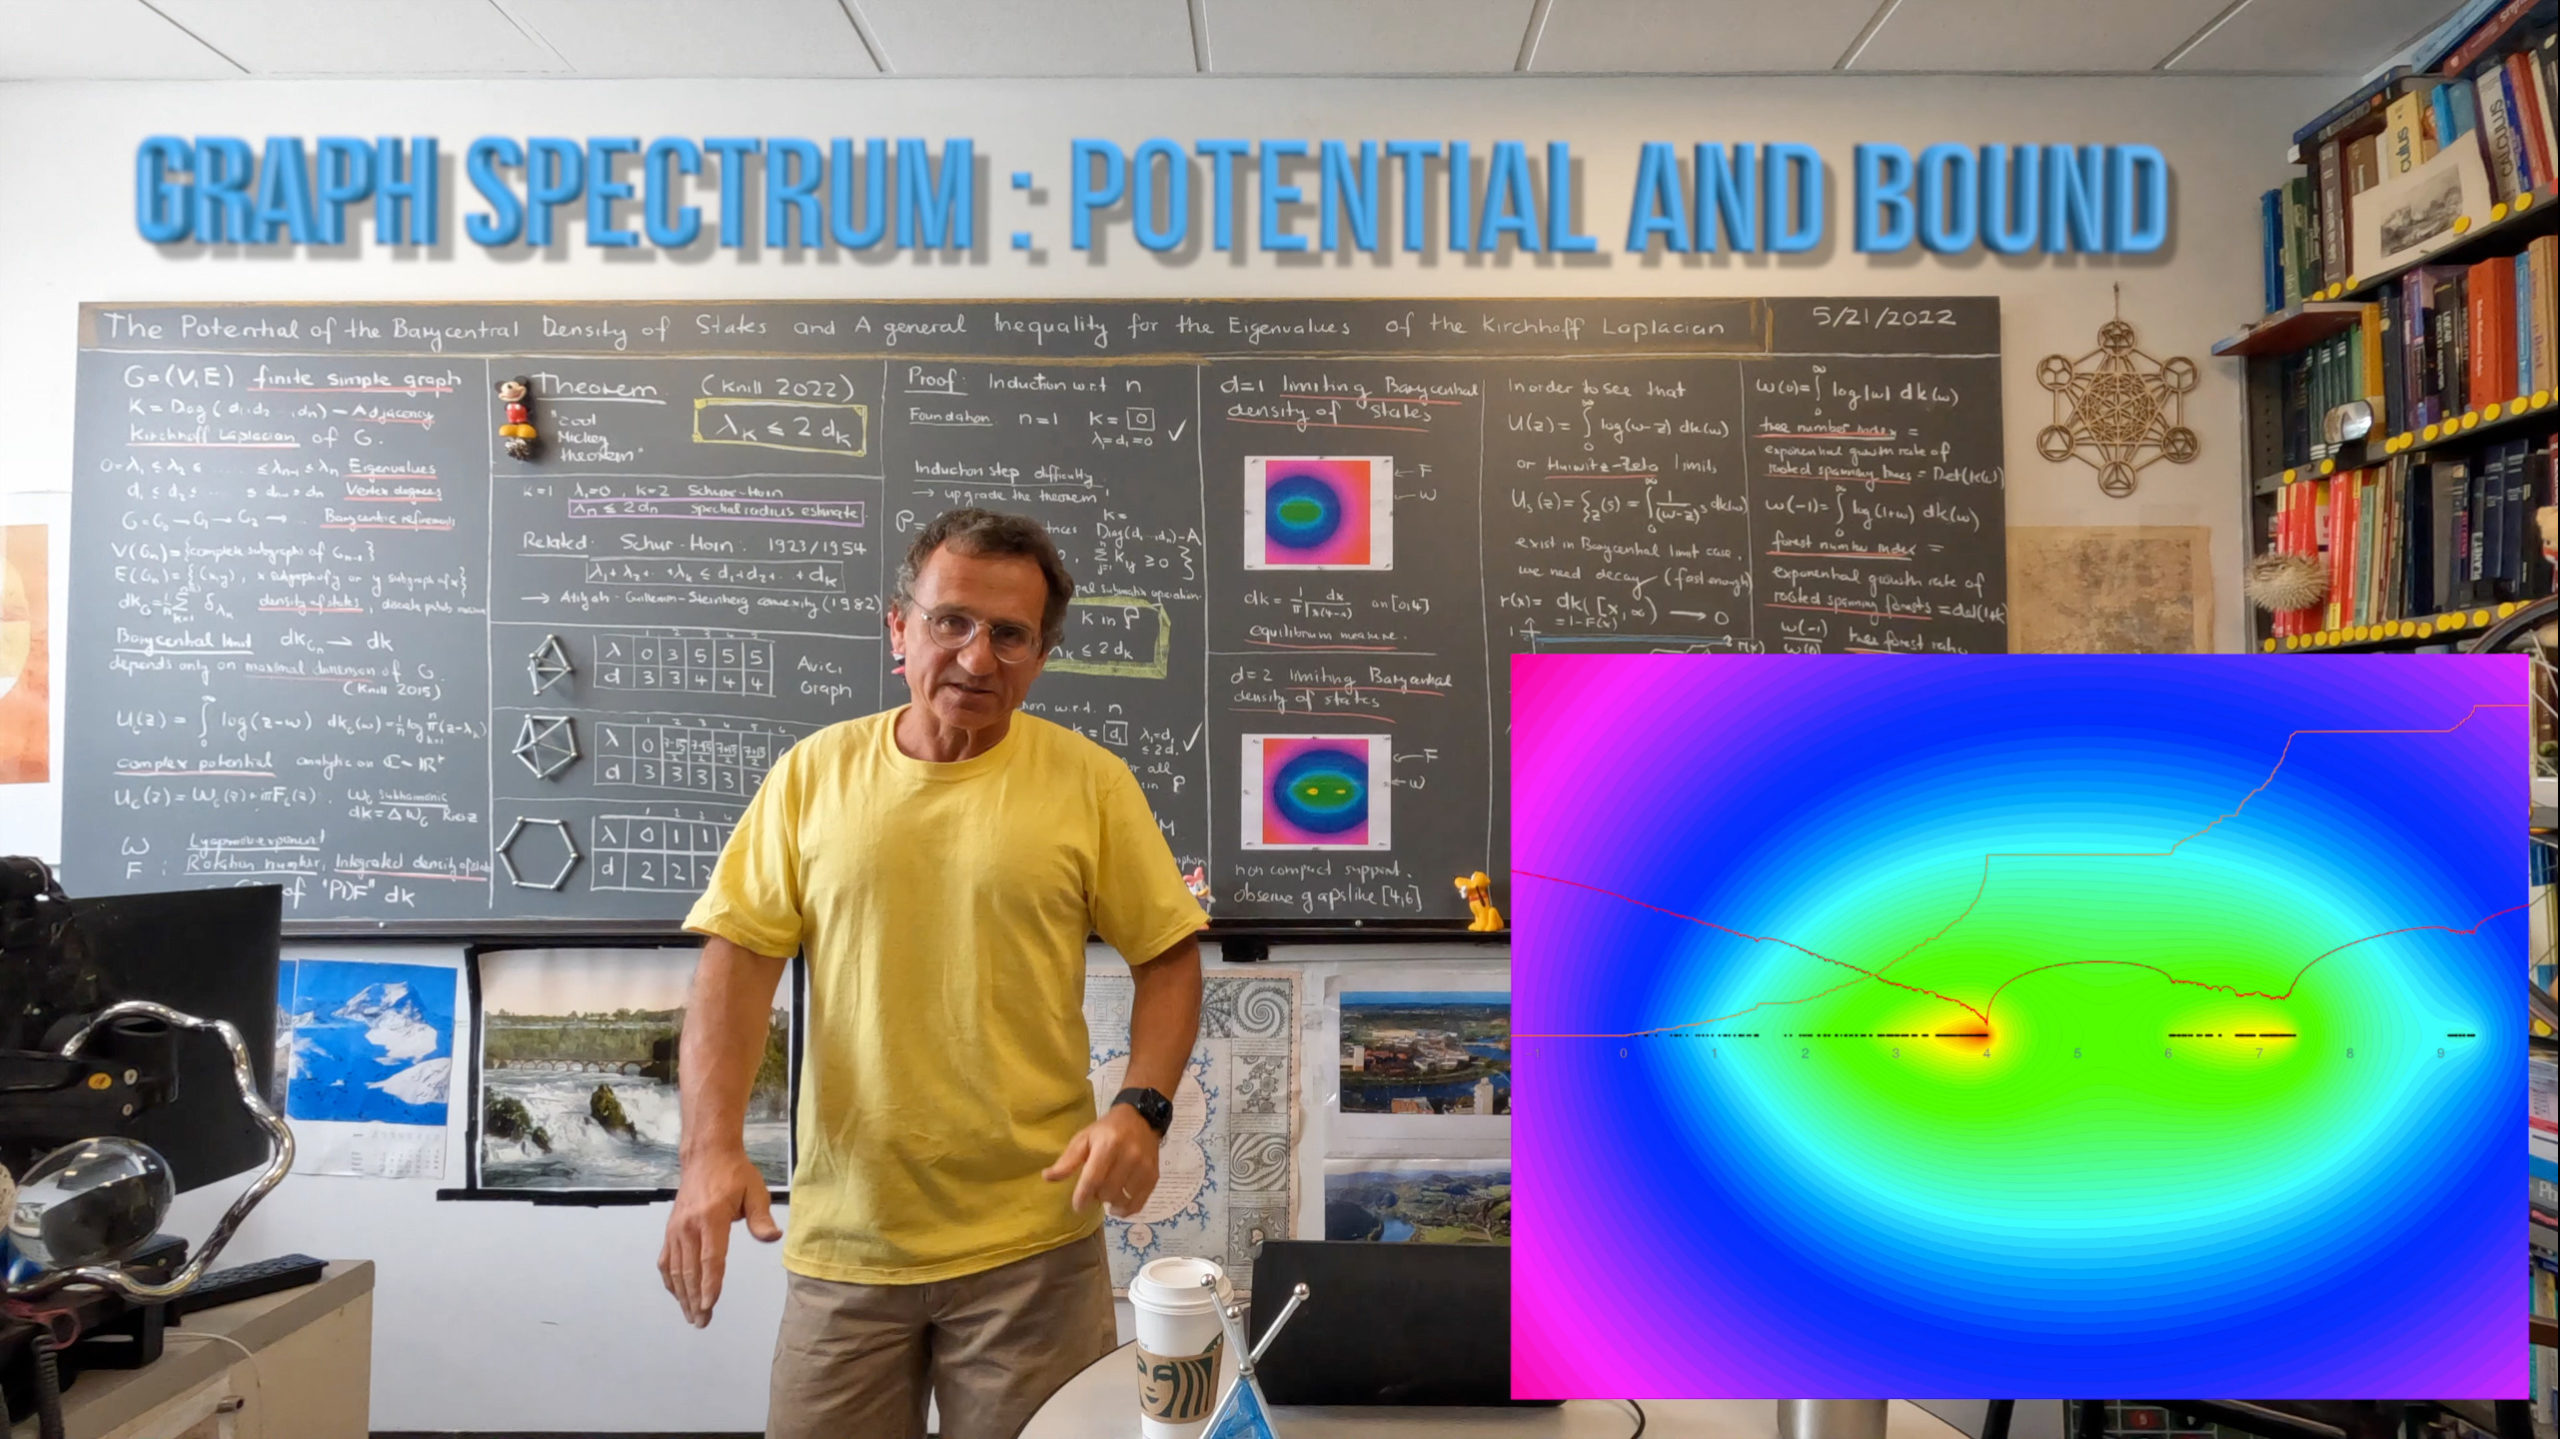
The paper on tree-forest ratios is here https://arxiv.org/abs/2205.10999. While writing this, I needed some reasonable upper bound estimates for the k-th eigenvalue. This is written down separately https://arxiv.org/abs/2205.10968. The second paper proves an surprisingly simple but apparently new inequality 


The main result on trees and forests is that in the Barycentric limit, the exponential growth rate of the number of rooted spanning trees as well as the exponential growth rate of the number of rooted spanning forests exists. We see these values as potential values U(0) or U(-1) of a potential function U. This subharmonic function has the universal density of states as Riesz measure. We understand the one-dimensional case very well as then the tree growth-rate (U(0)=0) and the forest growth rate U(-1)=2 log(golden ratio) are known and the Riesz measure is the equilibrium measure on [0,4] and is also known as the arc-sin distribution. In the two dimensional case, it appears that the spectrum has its support on a Cantor set. As we know that finite approximations are explicitly close to the limiting measure, we could in principle use computer assisted methods to prove rigorously that there are gaps. Very prominent is the gap [4,6] in the dimension 2 (graphs with some triangles K3 but no tetrahedral subgraphs K4). Here are the pictures from the paper:
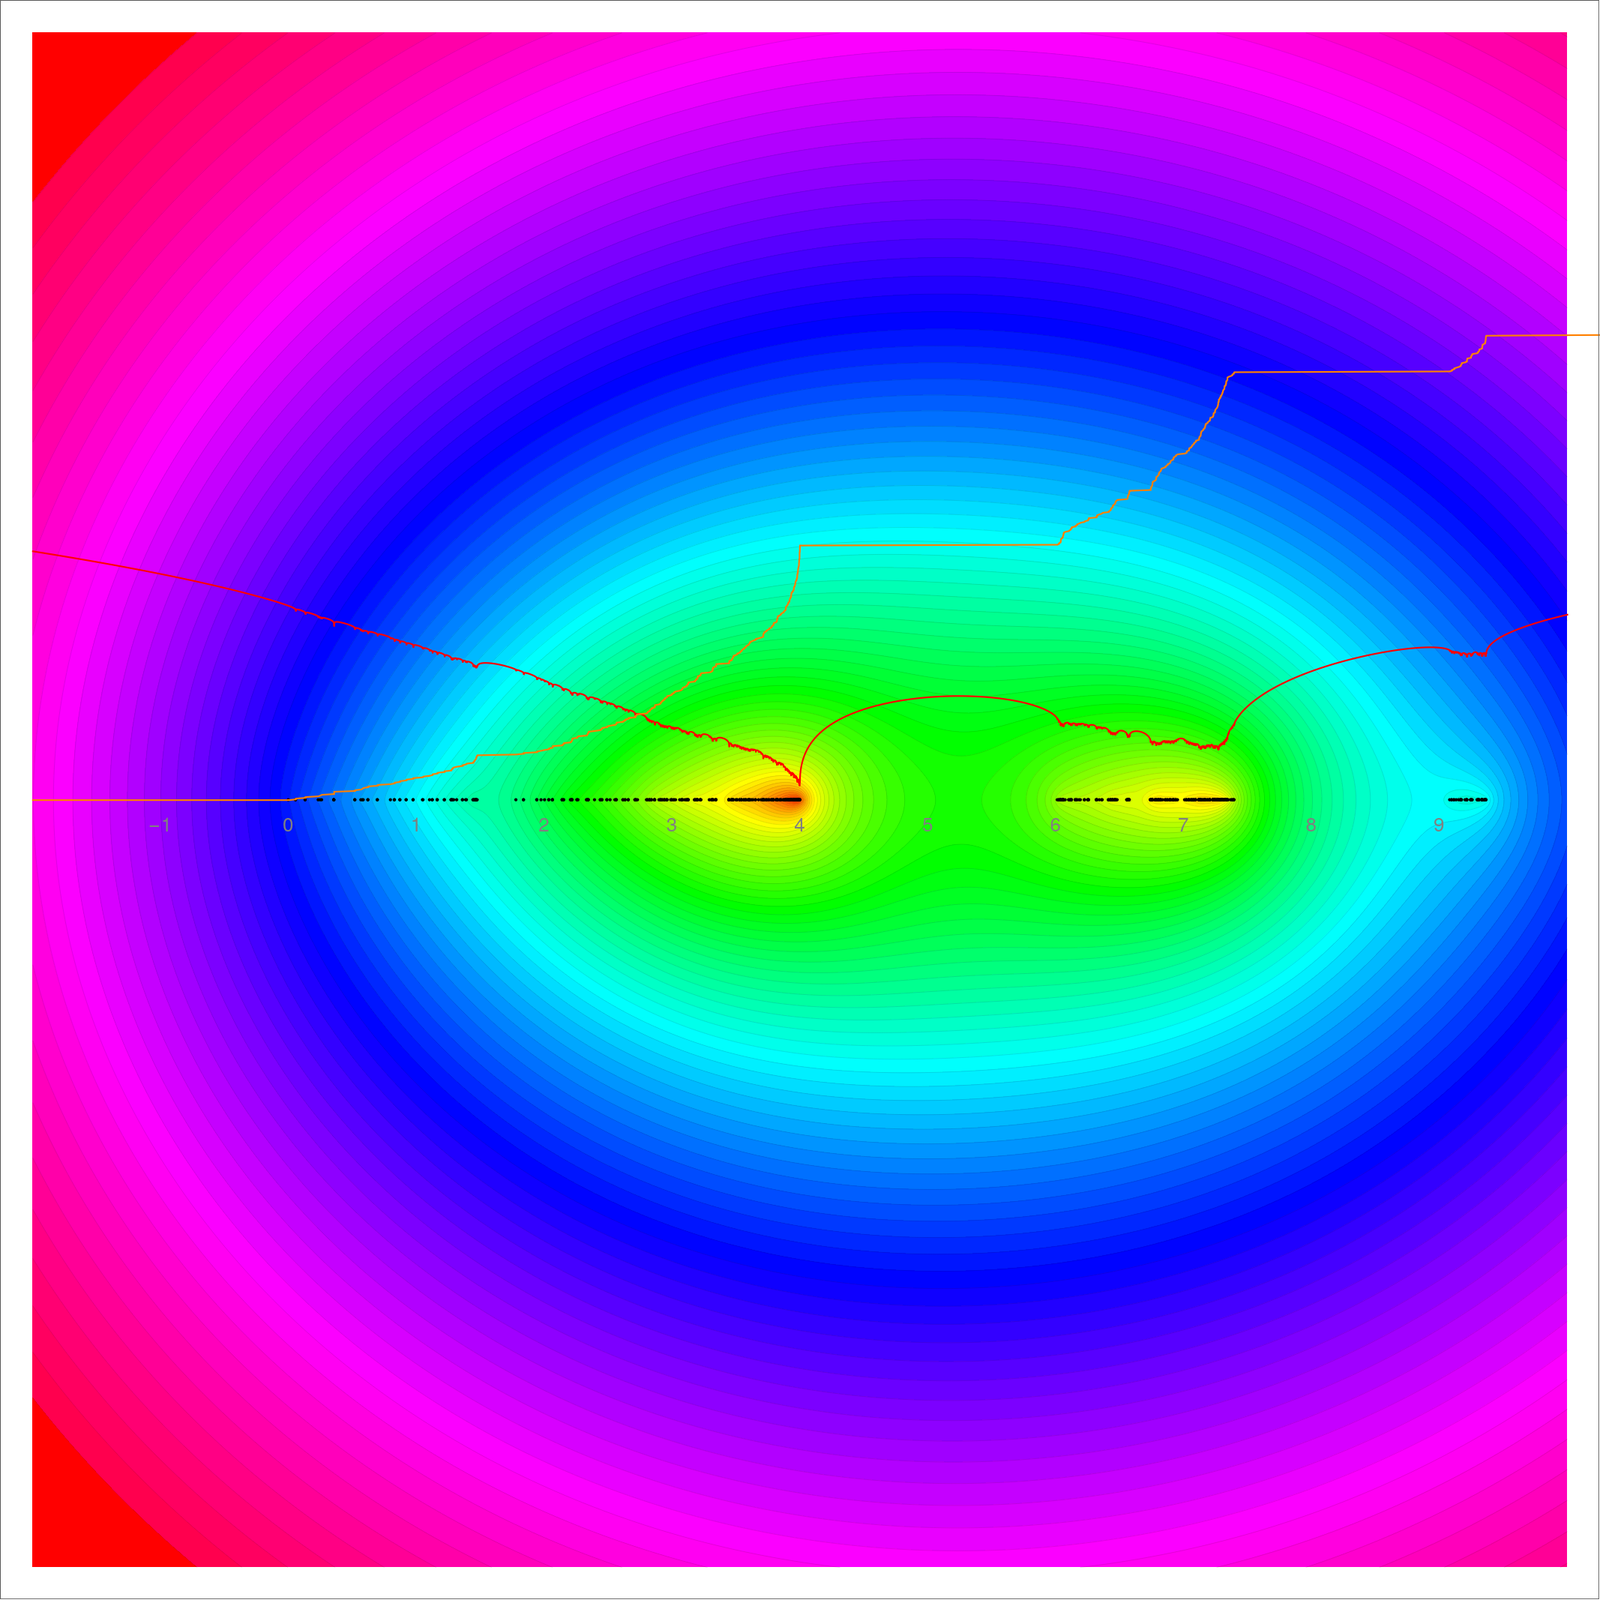
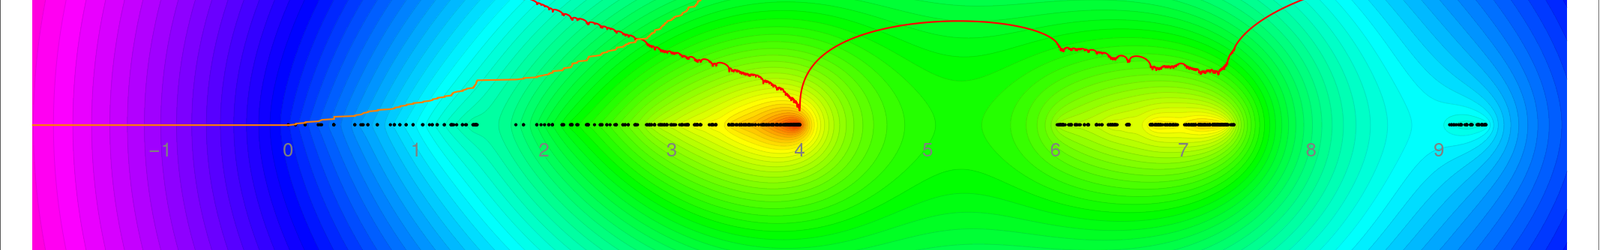
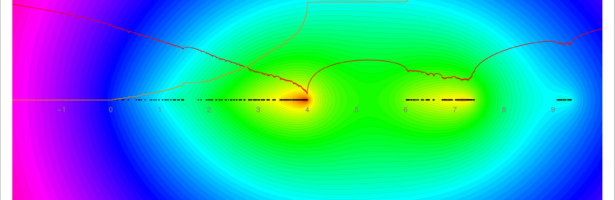
The spectrum in the 2-dimensional case. We see the real and imaginary part of the potential (Lyapunov exponent and integrated density of states in the Schroeinger operator jargon). We see clearly a gap [4,6] and the value of the integrated density of states is 1/2 there. 
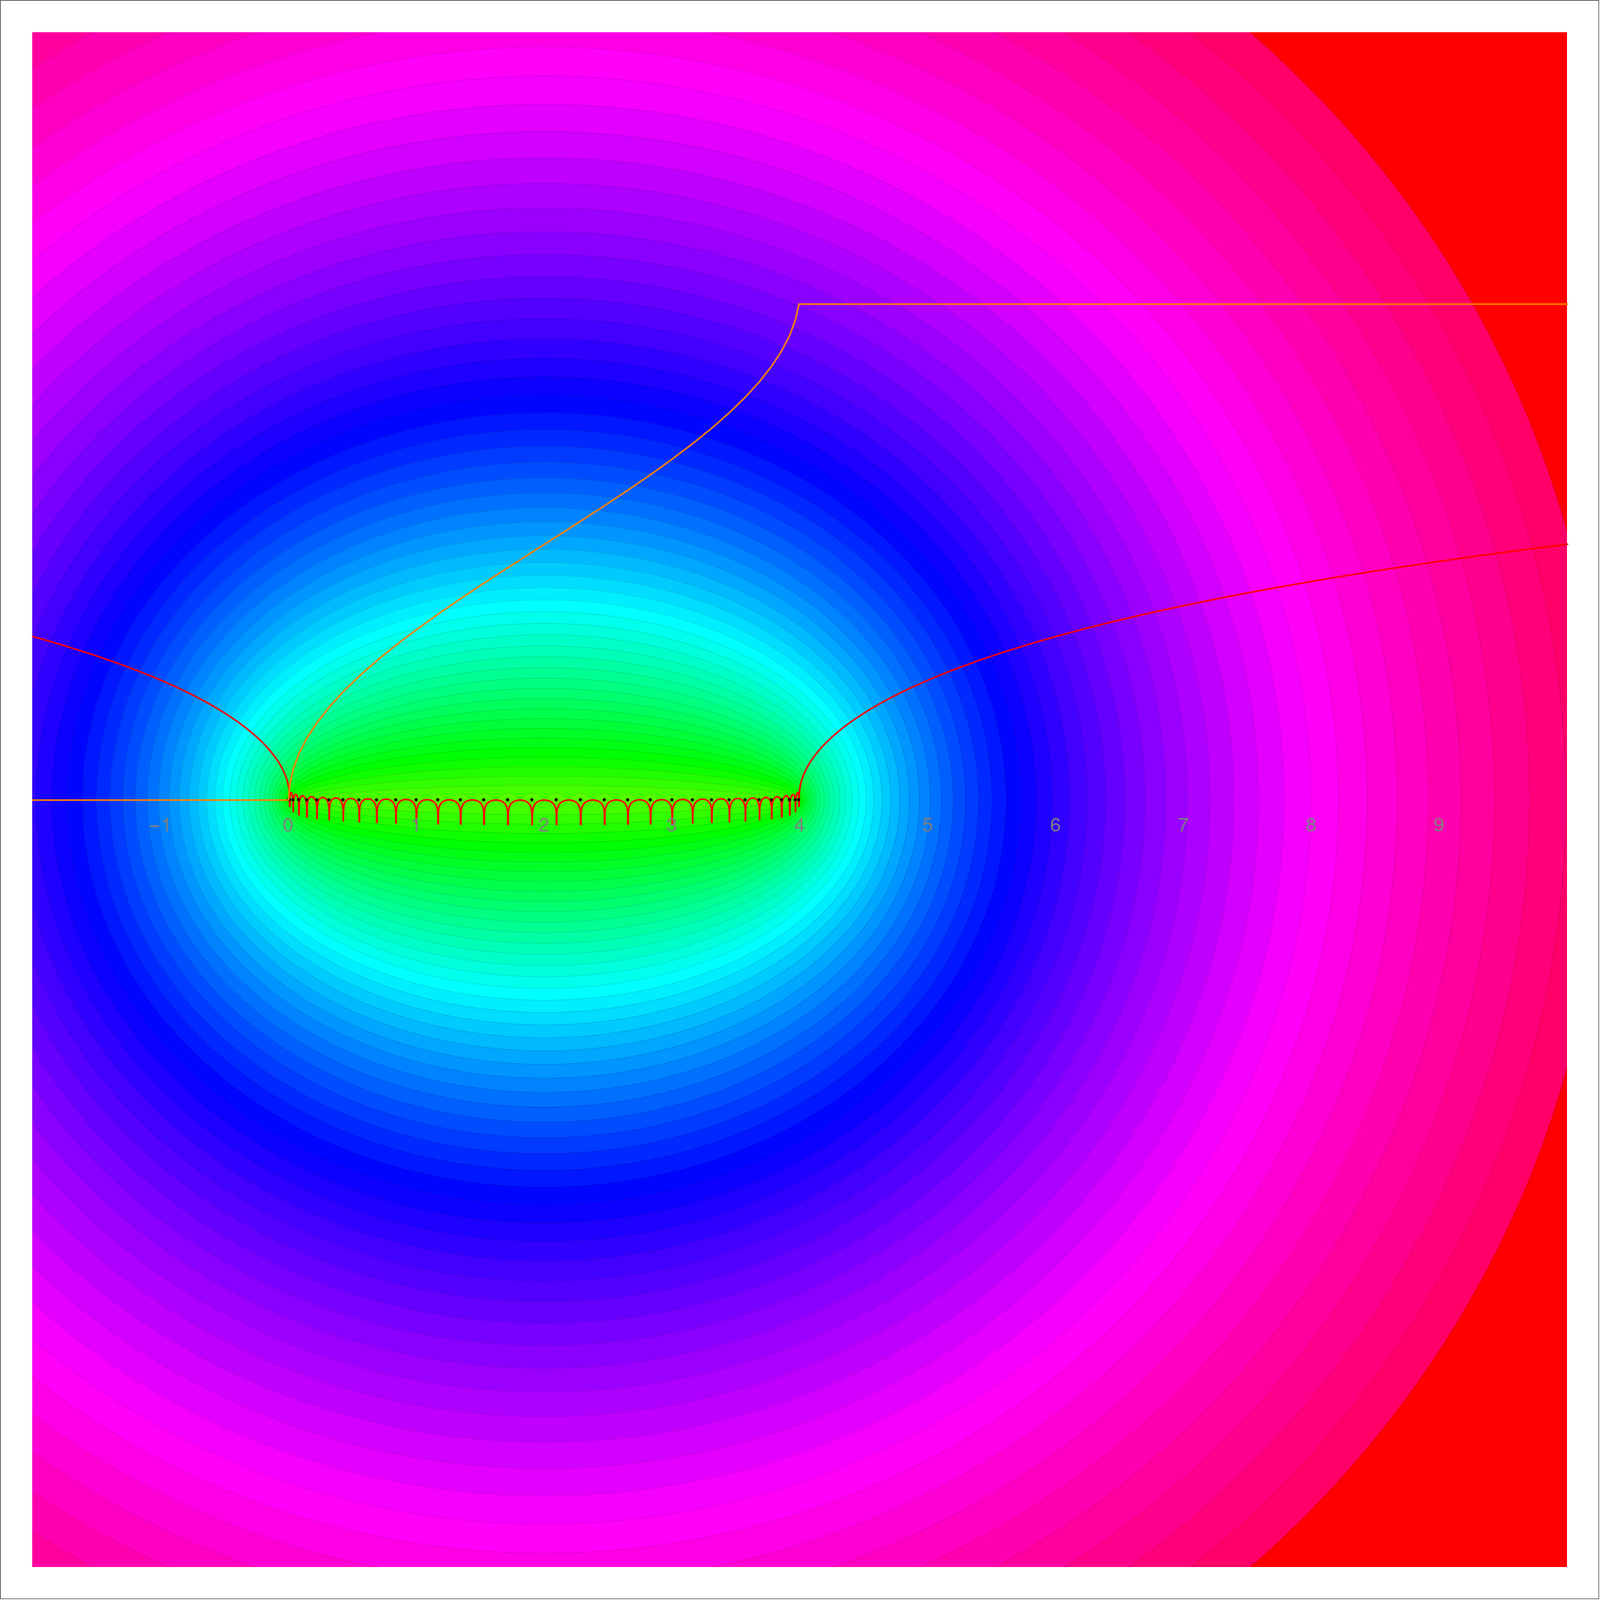
The spetrum in the 1-dimensional case, where the support of the spectrum is the interval [0,4] and the arc-sin distribution there. We again show the potential (which is zero exactly on the interval) and the integrated density of states which is a scaled arc sin function.
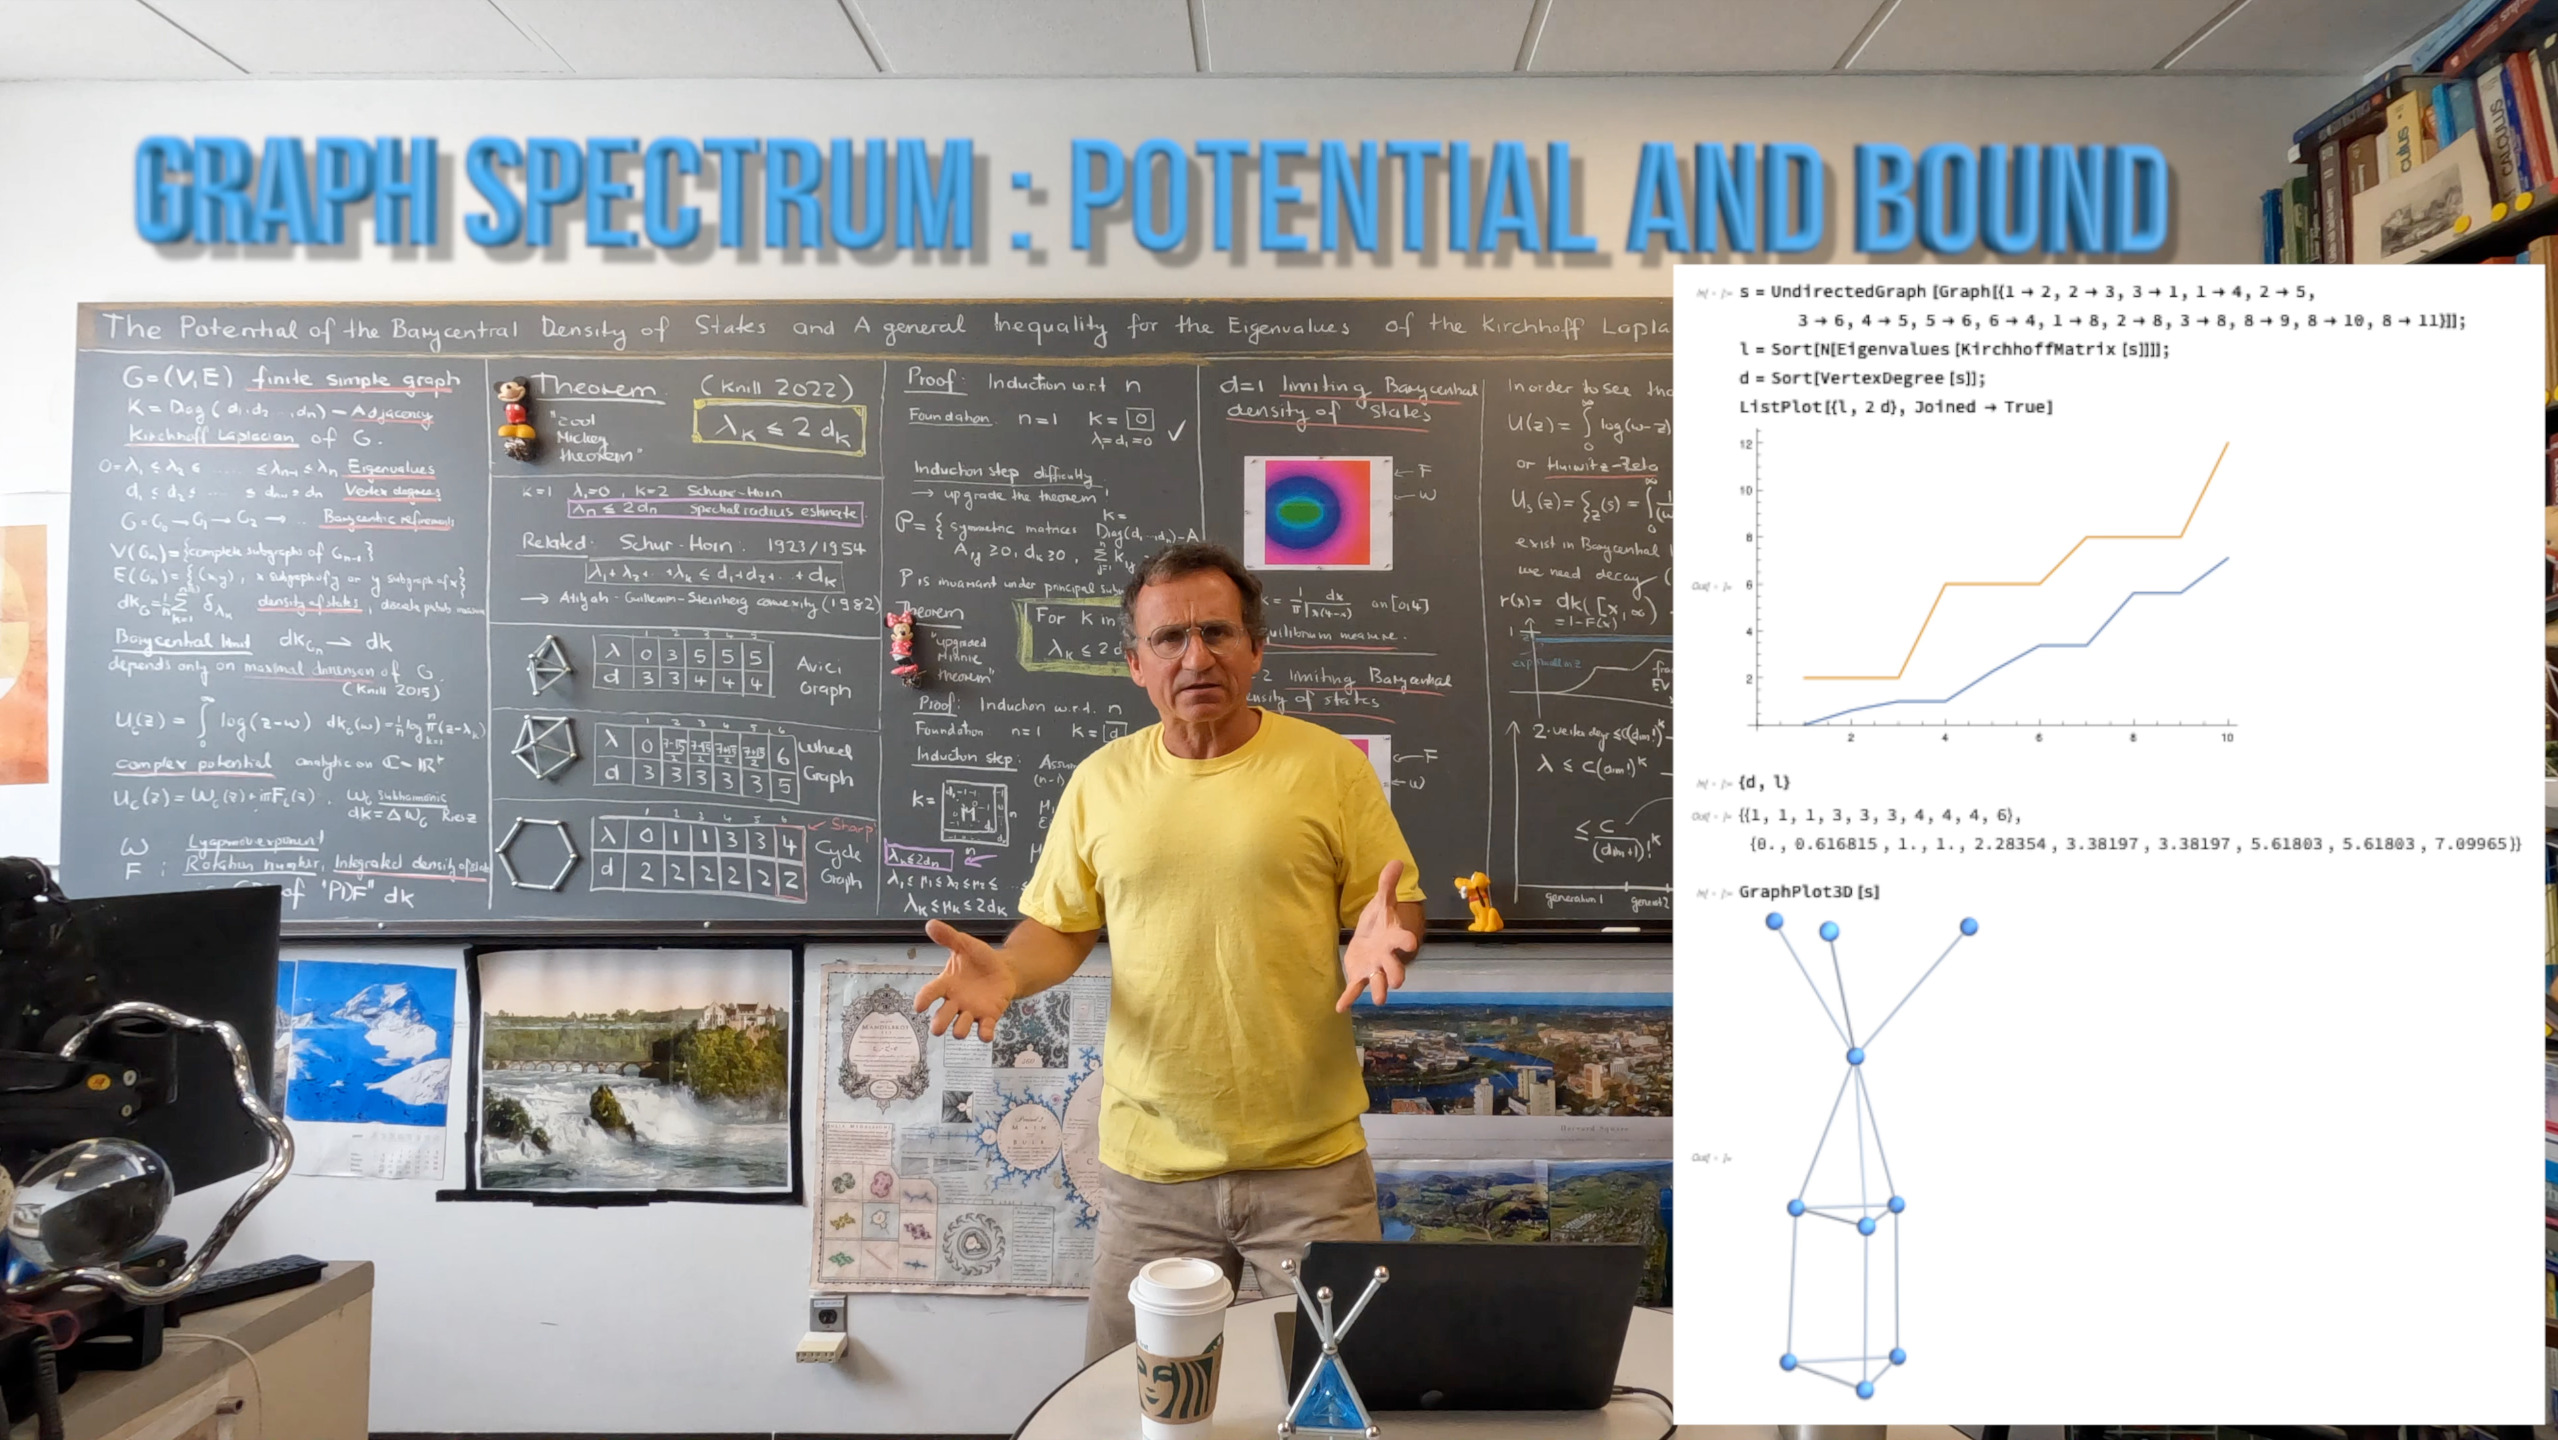
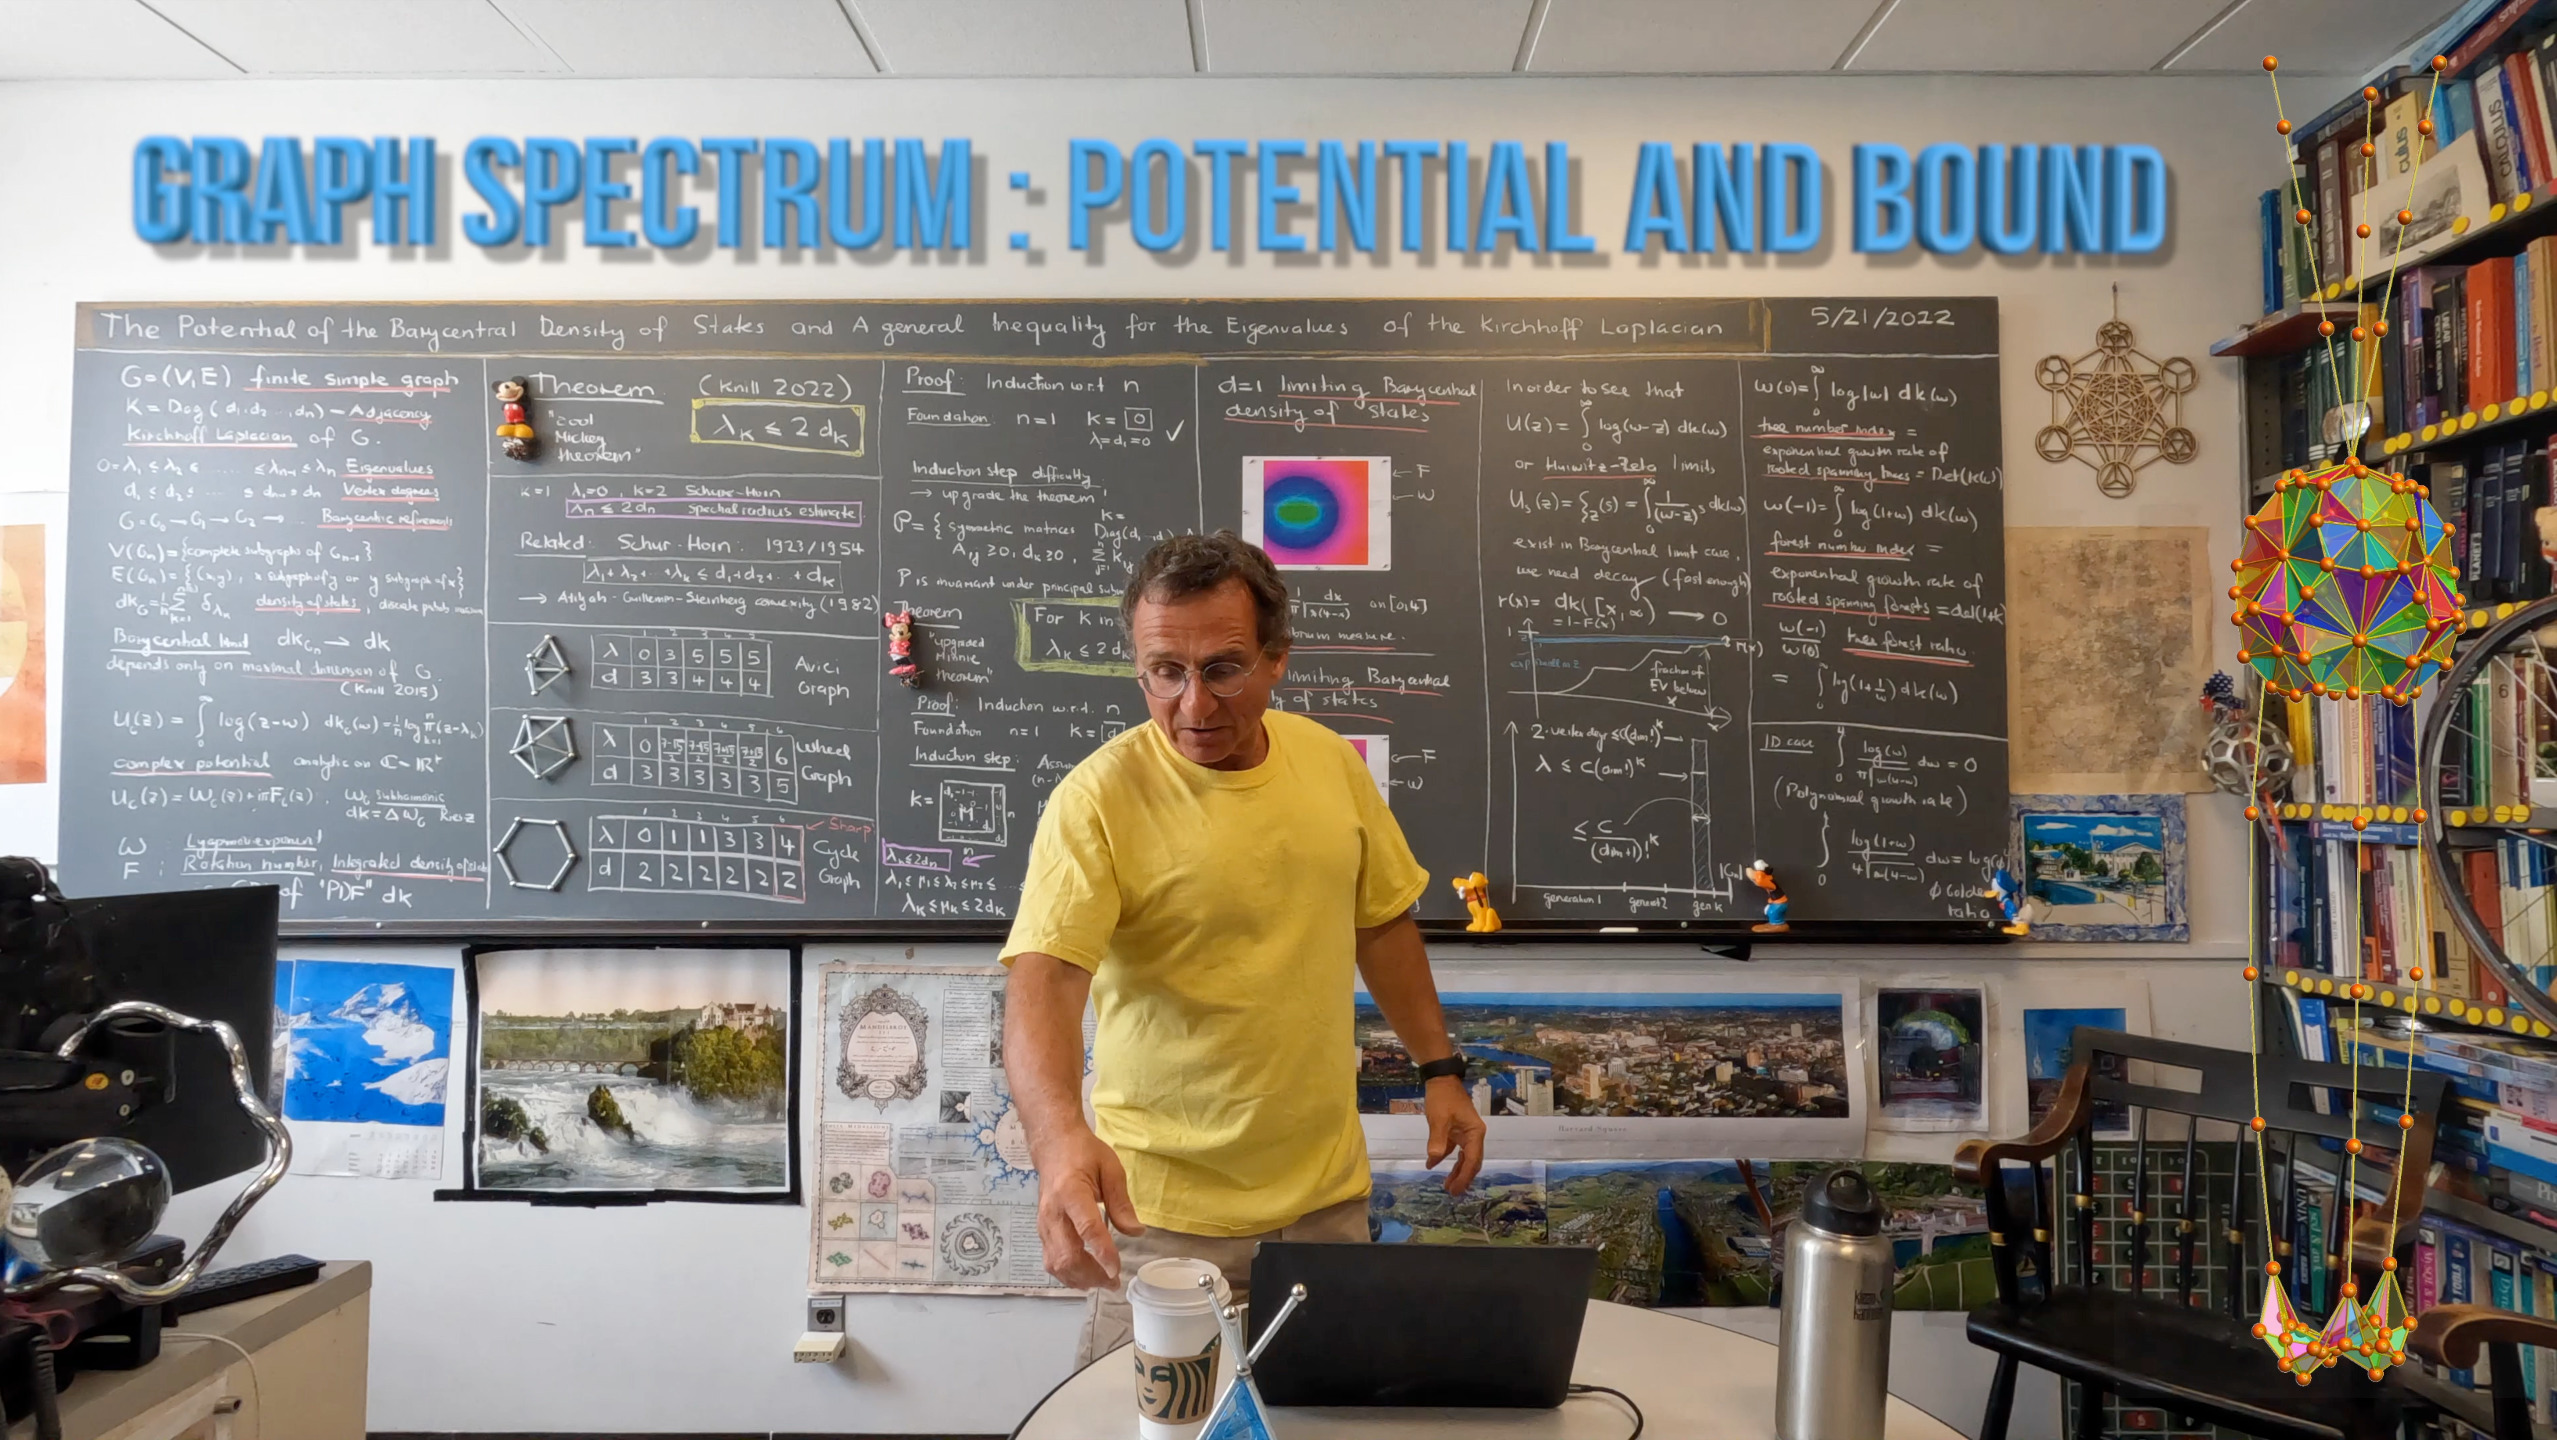
Here is some graphics added in an upgraded version of the paper: